
Latest Past Events

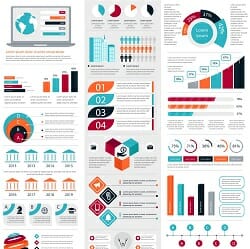
Creating Your Own Infographics

Zoom

Let's make data pretty! This CETL Session is all about Infographics. Simply put, an infographic is a visual representation of information. By combining elements of text, images, charts, or diagrams, an infographic is an effective tool to present data and explain complex issues in a way that can quickly lead to insight and better understanding.…


Webinar – How to Use Data to Put Learners First

Daumier Conference Room Daumier Building, Pomona

Institutional reports often highlight lagging indicators like pass rates or completion rates, data that shows what happened after an event took place. Often this information arrives too late for institutional stakeholders to intervene effectively. In this webinar, we will explore different ways higher education institutions are using their learning management system data to optimize student…