Creating Your Own Infographics
ZoomLet's make data pretty! This CETL Session is all about Infographics. Simply put, an infographic is a visual representation of information. By combining elements of text, images, charts, or diagrams,…

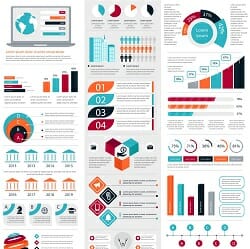
Let's make data pretty! This CETL Session is all about Infographics. Simply put, an infographic is a visual representation of information. By combining elements of text, images, charts, or diagrams,…

Grab your coffee and join us for an informal discussion on data literacy in higher education. We'll dig in to resources from the latest EDUCAUSE Showcase to investigate how you…

Institutional reports often highlight lagging indicators like pass rates or completion rates, data that shows what happened after an event took place. Often this information arrives too late for institutional…